As a Product Owner in software development there is a high probability that you are some how trying to get nice graphing in your product. I have been confronted with that over the past 10 years. No matter if you are in b-to-c or b-to-b you have to be able to visualize in many cases information in graphs for your users.
Graphing exists out of two part, as you may have discovered. First the getting your data right and next getting the image right. And any data engineer will tell you that the majority of the development time will be consumed by the first part. I like to talk about the second part. Now what can be so difficult with a graph.. Well a lot, I discovered while digging into that subject.
Picture the trend
First thing I realized is that people have no problem with recognizing an aged graph. Try it, you have no problem recognizing a graph that was created with the 2003 version of Excel. You instantly see it is old and outdated. So you, as a user, are trend sensitive when it comes down to visualization. And it fact graphing is extremely trend sensitive. If you dig into it you see something fascinating. In the pre-computer days visualizations where pieces of art. Look at this graph created in 1821 on some economical indicators.
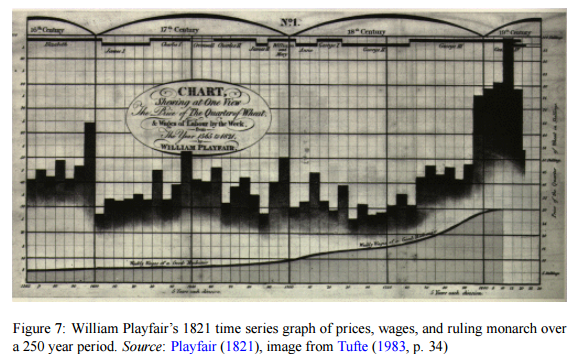
Then when computer generated graph became possible, graphs became extreme abstract and initially ugly. And when the graphical power increased the graphs again became more fancy.
Get the picture
But beside the way they looked there has been another development. This is about the principle of how a graph conveys information to you. What can you read in it. I like to use the example of the candlestick graph. A graphing technique used for simplifying time-series of stocks. This method tells the user in a single graph element 4 things and highlights up (Bullish) or down (Bearish)
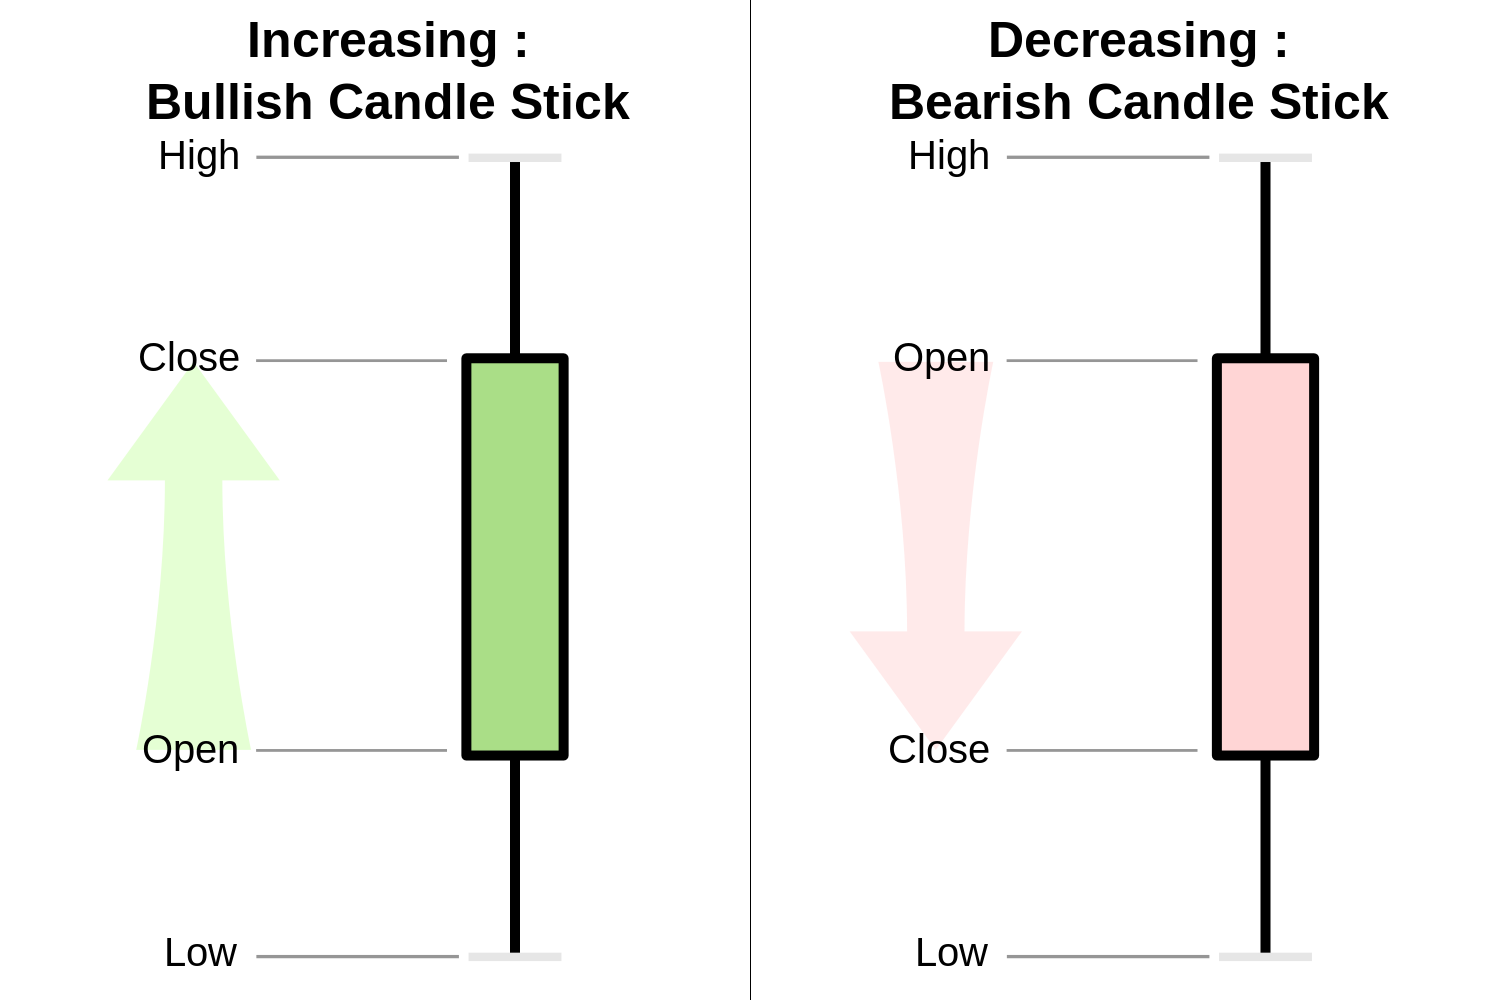
This way of charting has been the result of the need of user that requires a certain understanding of stock market price information in a blink of an eye. So it is completely the result translating technical and in this case financial innovation to user understandable information.
Innovation in modeling of graph
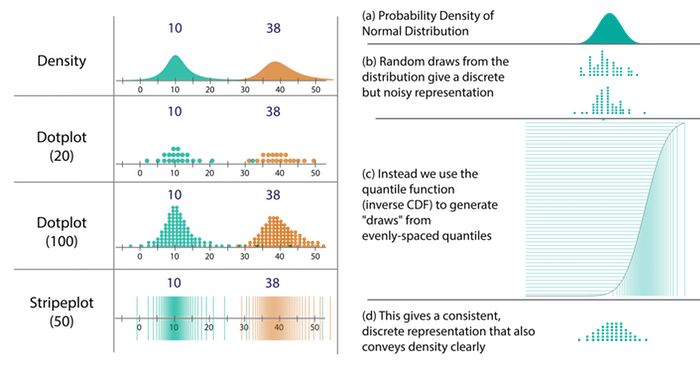
And it is exactly this innovation you should be aware of. Now we are living in the days of prediction. It is not unlikely that there is some functionality in your application that requires you to visualize a prediction. Luckily you do not have to figure out how to do that since there are people out there that have bent their brain over that challenge. For example this study of the University of Washington about how to let bus passengers understand the probability of making their transit. This is all about telling a story in a single graph. I am sure you can become inspired by this when dealing yourself with visualizing predictive information.
This to me proofs that each innovation in data can result in new visualization challenges. Therefore it is valuable to stay up to date on these types of developments.
Now some predictions
Let me make a small prediction myself. The need for presenting information based upon all kind new data techniques will grow, and you need to be aware of all developments and research out there to bring understanding to your users.
Understanding this should make you, as a product owner, and your team, architect and UX people, really conscious about what graphical libraries you will use in your application. Whatever you choose, make sure the user base is big enough, the development is very active and it is integrating all these new methods and trends of visualization. If you don’t do that you will end up with aged graphs 3 years from now.
Check the site of UW Interactive Data Lab if this story triggered some curiosity.